
Edit: Hi everybody. I had no idea our little experiment would get so much attention. I’ve rebooted the project in hopes of turning it into a public tool. Keep an eye out for the first release of bennedetto - coming soon!
Any couple that says they never fight has probably never had to talk about money. I know this because Marissa and I used to be that couple. When you are dating, money isn’t an issue. It’s a special occasion every time you see each other, so nobody feels guilty springing for movie tickets, dinner, or betting on one of Wheaton’s famous underground cock fights.
But now we argue about money. Arguments aren’t a bad thing. I welcome an argument as long as something good comes out of it.
Money is going to add friction to any relationship, especially if you don’t have a good system in place. I succumbed to the temptation of allowing my checking balance to govern my mood. Every two weeks, I would be on top of the world, then a dull panic would creep over me as the days passed - seasoned with the occasional blowup about an expense that I didn’t plan for that always seemed like it would be the end of me. Then I would get paid again. It was a roller coaster, and I had no insights into how much money we were really saving and spending.
Marissa and I knew that we needed a budget. At the very least, I just needed to feel like I was trying. That way if our financial lives were decimated I could at least point to something and say See? At least we had a budget!
We spent a few months shopping around for a system we liked. Mint.com, Dave Ramsey, free consultations - nothing quite felt right. My complaints with whatever we were trying were usually one of these three:
Please don’t send me an email defending your favorite system. I know a handful of people who were rescued from crippling debt by Dave Ramsey, or who follow mint.com like it’s a religion. Whatever you use fits your needs, but it didn’t fit ours.
My wife and I play Sid Meier’s Civilization together - especially on nights where we need to take our thoughts off of money. It’s one of those turn-based games where you run a group of people, settle somewhere on the globe, and slowly build cities and armies until you take over everyone.
Each turn, the game tracks your income and expenses in food, gold, and happiness. They are shown in an indicator bar like this.
The numbers beside the gold coin represent how much gold you have in total, as well as how much you are making or losing every turn. Mousing over the gold coin shows a more granular breakdown of where all your spoils are going.

Certain buildings or factions cost gold to maintain, just as certain buildings make gold. Each source of gain and loss is part of how much gold you are making or losing per turn.
One night while we playing I sleepily remarked how I wish we could see a breakdown like that for our money. I elaborated on how cool it would be if we could pay our bills this way. I was tired of trying to assess how we were doing financially while our account balance was jumping around so dramatically month to month. I wished instead that money could come in and go out more consistently - like water draining from a faucet.
That got me thinking - what is stopping us from finding out how much money we are making daily? If our life were a Civ game, how much “gold” would we be making every “turn”?
I wanted to find out how much money we were making every day. This was not an estimate. I was tired of estimations. I wasn’t going to attempt to include things like gas, our electric bill, or groceries. I’m talking about straight automated cash - like how much I would be making if I could cryogenically freeze myself and somehow continue to get a paycheck and pay bills.
My first thought was Netflix. It’s $8 a month, and it is setup to just take money out of my PayPal account. In a scenario like this, Netflix would continue to get their money. I made a table like this.
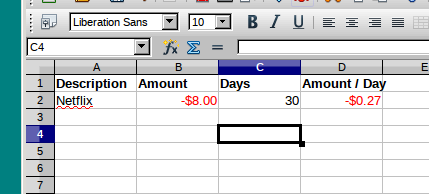
By taking the amount due on each bill ($8), the number of days per bill (30 - roughly a month), I could get the amount of money Netflix costs per day by just dividing Column B by Column C - $0.26 per day.
Now another automatic expense. I own the domain [alexrecker.com], which costs me $10 a year. My domain provider withdraws money from my account when they need it. I added it to the table.
Using the same method, it is clear that [alexrecker.com] costs me $0.03 a day. A sum of column D will give me a net loss of all my bills per day - so far just Netflix and my domain.
I did this for every expense I could. Again, because this was a calculated rate, only bills that were totally fixed and automated could be included.
Once I had all my bills in, I added my paycheck. Summing all my daily expenses with my daily income gave me the magic ‘gold per turn’ number I was looking for. I was happy it was positive.
The best part about this number was that there was almost no estimation involved. I didn’t have to make any wild guesses about things I didn’t care about to get instant feedback. Knowing how much money I get to keep in a day was already giving me a valuable objective perspective.
This number was great, but not everything in life can be automated. We had to come up with a way to get feedback from one time purchases and semi-regular expenses as well.
I opened a new LibreOffice spreadsheet that looked like this.
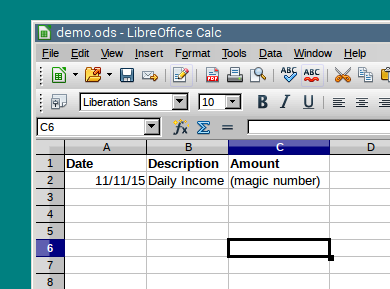
This was where I kept track of my daily expenses. All I needed was the date, a description of what it was (to jog my memory if I was to go over it again), and the amount.
I started the new sheet with the magic daily number I calculated before, which is a positive number. Any purchases I made that day would be entered in as negative amounts. Likewise, if I came upon cash it would be entered as a positive amount.
At the end of the day, it was safe to say that the sum of Column C represented how much money I made that day. If it were negative, that means I spent more money than I make in a day. If it were positive, that means I saved.
What I had here was more instant feedback. Now I was keeping track of how much I was saving every day.
Next morning, I opened a new sheet and started it like the last, opening it with a positive transaction of the magic number. My cellphone bill was due that day, and since the total depends on how much data my wife and I use, that could not be part of our magic number. I paid the bill, which made us very negative for the day.
While some days were negative, I could still add up each day of the week to find out how much I saved over the past few days. If I had a bad week, I could theoretically add up each week to get a number for the month.
I rigged up the spreadsheet to give me these numbers on a summary page.
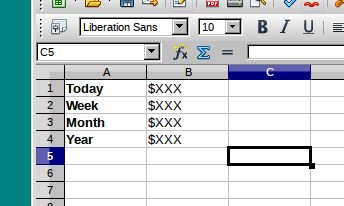
This sheet told me the running total for that day, the week, the month, and the year. When I first started, all four numbers were identical, but as the weeks turned over, I started to more diverse results. While my daily total would fluctuate from exactly my magic number in the morning to well negative when we would go out to eat, the weekly and monthly average would even things out. As long as our weekly and monthly total was positive, we didn’t have to worry too much. If those started to dive, we would change our habits and keep our daily total positive until our other numbers began to improve.
Here’s what I love about this system:
Our new budget has evolved quite a bit beyond my LibreOffice spreadsheet. I’ve moved the operation to a Django web application. This allows me to automate calculating my magic number, opening new days, and entering in purchases. Being able to access our budget from a mobile friendly website also makes the data entry less painful.
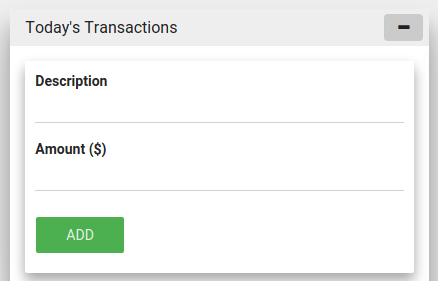
Our dashboard lists the purchases we made that day.
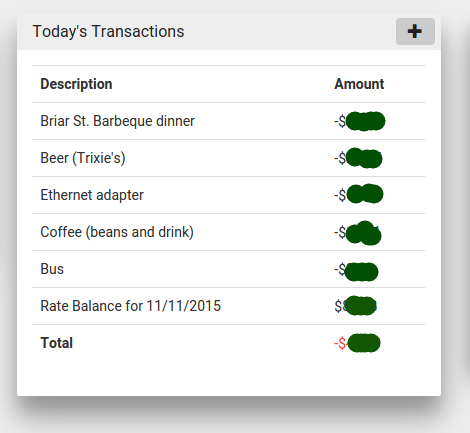
When we make a purchase, there is a form that flips out from the top. It was very important to me that this form include as little information as possible.
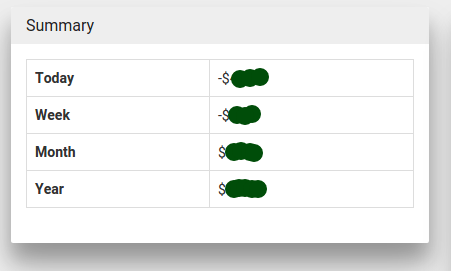
Beside it, there is a widget to show us the running total for the day, week, month, and year.
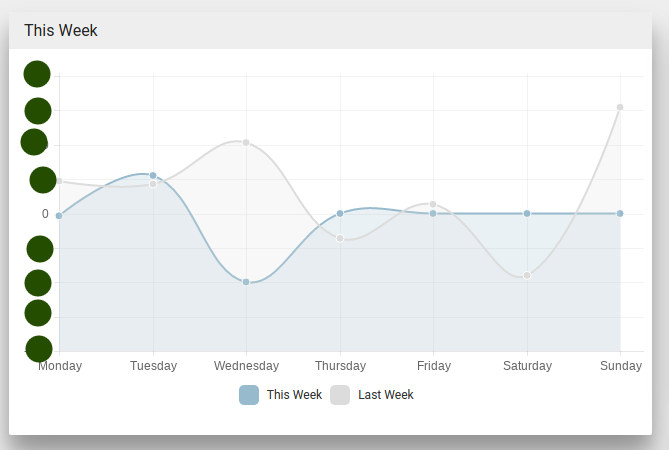
Here is the fun part. I made a few graphs to give us an idea of how we are doing. This is a graph that shows us what our total was each day, along with the corresponding day from last week. This is valuable when we are picking which days we are going to go out to eat.
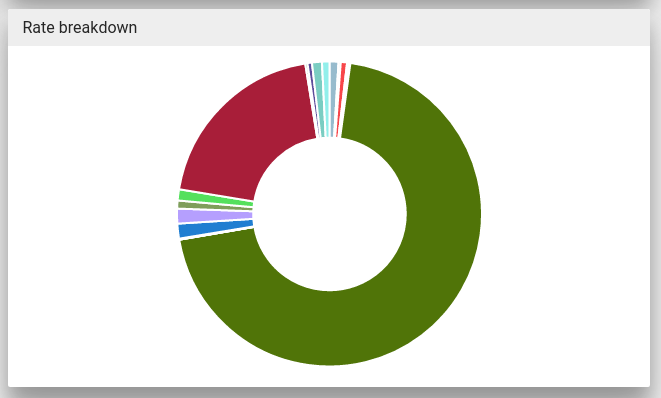
This is a break down of all the expenses and sources of income that make up our magic number that opens each day with a positive amount. The slices are automated expenses mixed with automated income, but I plan on color coding it to make it a little easier to see.
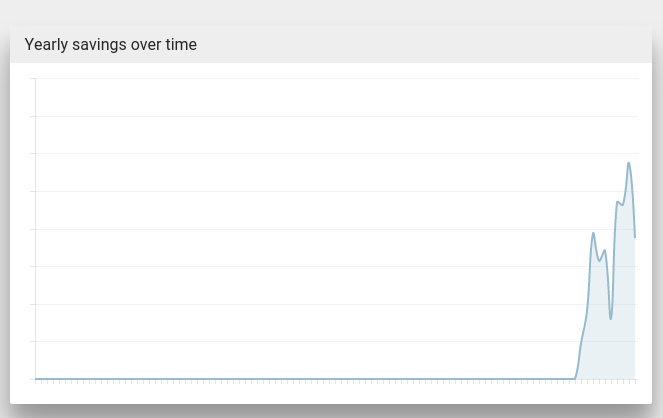
This graph shows the progression of what the yearly savings number was on any given day. I’m still waiting for this one to even out, but once it does, it should give us a good idea of how much we are saving in the long run. Ideally, we would like it to slowly climb despite daily flux.
So that’s our Civ inspired budget. I’m sure you have a system of your own, but I wanted to share ours just in case you are still shopping for a good fit.
As I mentioned, my new budget is powered by a Django app I put together that is getting better over time. You can view the source here, but I wanted to take you through a few snippets of how I got Django and Angular to do all the work for me.
The first model was a
Rate. This
represented an automatic expense or income that I could factor into the
daily magic number.
from uuid import uuid4
from django.db import models
from django.core.validators import MinValueValidator

class Rate(models.Model):
    id = models.UUIDField(primary_key=True,
                          editable=False,
                          default=uuid4,
                          unique=True)

    description = models.CharField(max_length=120)
    amount = models.DecimalField(max_digits=8, decimal_places=2)
    days = models.PositiveIntegerField(validators=[MinValueValidator(1)])
    amount_per_day = models.DecimalField(max_digits=8,
                                         decimal_places=3,
                                         editable=False,
                                         blank=True)
UUIDField. I
just prefer this over the default int because I think it looks cooler in
a database. Django’s documentation shows how to do this.
I figured these
Rate models
would be read more often than written , so I made
amount_per_day a
field as opposed to a calculated value.
For this reason, a custom
save routine on
the model was needed to populate it each time it changed.
from decimal import Decimal

class Rate(models.Model):

    '''...rest of model...'''

    def save(self, *args, **kwargs):
        self.amount_per_day = self.amount / Decimal(self.days)
        return super(Rate, self).save(*args, **kwargs)
Next, I needed a way to sum these up. Django’s ORM supplies a handy aggregate function, as well as a QuerySet API to make any custom manager functions chain-able.
I defined a custom
QuerySet for
Rate and
associated it to the model using
.as_manager().
from django.db import models

class RateQuerySet(models.QuerySet):
    def total(self):
        return self.aggregate(models.Sum('amount_per_day'))['amount_per_day__sum']


class Rate(models.Model):
    objects = RateQuerySet.as_manager()
Now, I can filter for any conditions I want and retrieve the total from
calling my own
.total().
My second model is a
Transaction,
which represents any exchange of money I would record.
from myapp.utils import get_timestamp  # just gets a timezone aware datetime

class TransactionBase(models.Model):
    id = models.UUIDField(primary_key=True,
                          editable=False,
                          default=uuid4,
                          unique=True)

    description = models.CharField(max_length=120)
    timestamp = models.DateTimeField(default=get_timestamp,
                                     editable=False)
    amount = models.DecimalField(max_digits=8, decimal_places=2)
I added a similar
QuerySet with
functions to fetch the total as well as any helpful date range.
class TransactionQuerySet(models.QuerySet):
    def total(self):
        return self.aggregate(
            models.Sum('amount'))['amount__sum'] or 0

    def date(self, date):
        return self.filter(timestamp__month=date.month,
                           timestamp__day=date.day,
                           timestamp__year=date.year)

    def date_range(self, start, end):
        return self.filter(timestamp__lt=end,
                           timestamp__gt=start)

    def today(self):
        return self.date(get_timestamp())

    def days_ago(self, n):
        return self._from_today(n)

    def this_month(self):
        date = get_timestamp()
        return self.filter(timestamp__month=date.month,
                           timestamp__year=date.year)

    def last_week(self):
        return self._from_today(7)

    def last_month(self):
        return self._from_today(30)

    def last_year(self):
        return self._from_today(365)

    def _from_today(self, days):
        today = get_timestamp()
        start = today - timedelta(days=days)
        return self.date_range(start, today)


class Transaciton(models.Model):
    objects = TransactionQuerySet.as_manager()
Because the app was restful, I knew I was going to end up sending ISO date strings from Moment.js down to the server. I wanted to still be able to send strings into these methods, so I decided to handle all the str to datetime conversion in one place with a decorator and the dateutil package.
The decorator
@sanitize_dates
simply attempts to parse each argument into a datetime before invoking the
QuerySet method.
from dateutil import parser

def sanitize_dates(func):
    '''
    attempt to convert stringy dates
    to real dates
    '''
    def wrapper(self, *args):
        clean_args = []
        for arg in args:
            if type(arg) is not datetime:
                try:
                    parsed_date = parser.parse(arg.replace('"', ''))
                    zoned_date = get_timestamp(parsed_date)
                    clean_args.append(zoned_date)
                except ValueError:
                    clean_args.append(arg)  # just pass it in as is
            else:
                clean_args.append(arg)
        return func(self, *clean_args)
    return wrapper

class TransactionBaseQuerySet(models.QuerySet):
    @sanitize_dates
    def date(self, date):  # now you can send a string into me!
        return self.filter(timestamp__month=date.month,
                           timestamp__day=date.day,
                           timestamp__year=date.year)
The rest endpoints were setup with
django rest framework.
Using its
ModelViewSet,
ModelSerializer,
and
DefaultRouter,
it was stupidly simple.
The frontend is using angular. After logging in, the app serves up a
single
index.html
routed as a
TemplateView .
This is guided by
urls.py.
from django.conf.urls import url
from django.views.generic import TemplateView
from django.contrib.auth.decorators import login_required

urlpatterns = [
    '''... other rules...'''

    url(r'^$', login_required(TemplateView.as_view(template_name='index.html')))
]
This template serves up the static scripts, which are bundled and minified
in production by
django-compressor. The template is split into various
include blocks
to fetch bower components and other resources.
Because this is the last interface between vanilla Django and angular, I used the template engine here to inject any urls and other constants into the app.
<script>
 angular.module('moolah')
        .constant('STATIC_URL', '/static/')
        .constant('API_URL', '/api/')
        .constant('LOGOUT_URL', '{% url 'django.contrib.auth.views.logout' %}')
        .constant('USER_NAME', '{{ user.get_full_name }}');
</script>
By invoking Django’s named URLs in inline JavaScript and saving them off into angular constants, I can avoid hard coding these or having to query for them later.
To get various template paths, I made an angular service that consumes the
STATIC_URL
constant.
angular.module('moolah')
    .factory('toStatic', ['STATIC_URL', function(STATIC_URL) {
        return function(i) {
            return '{}{}'.format(STATIC_URL, i);
        };
    }]);
Using the same method, I created a resource service to consume the
API_URL
constant.
angular
    .module('moolah')
    .factory('TransactionService',
             ['$resource', 'API_URL',
              function($resource, API_URL) {
                  return $resource('{}transactions/:id'.format(API_URL));
              }]);
To grab miscellaneous report-like data (like the ‘Summary’ card), I added an API path for each ‘report’. This call gets our running daily, weekly, monthly, and yearly total.
from rest_framwork import views, response
from models import Tranaction

class SummaryView(views.APIView):
    def get(self, request):
        t = Transaction.objects

        data = {'day': t.today().total(),
                'week': t.last_week().total(),
                'month': t.last_month().total(),
                'year': t.last_year().total()}

        return response.Response(data)
This is how I’m getting that ‘this week vs. last week’ line graph.
class DailyTransactionReportView(views.APIView):
    def _get_week_dates(self, weeks=-1):
        today = get_timestamp()
        monday = today + relativedelta(weekday=MO(weeks))
        return [monday + timedelta(days=n)
                for n in range(7)]

    def get(self, request):
        t = Transaction.objects
        labels = ['Monday',
                  'Tuesday',
                  'Wednesday',
                  'Thursday',
                  'Friday',
                  'Saturday',
                  'Sunday']

        this_week = [t.date(d).total()
                     for d in self._get_week_dates()]

        last_week = [t.date(d).total()
                     for d in self._get_week_dates(-2)]

        return response.Response({'labels': labels,
                                  'data': [this_week,
                                           last_week],
                                  'series': ['This Week', 'Last Week']})
The reports are consumed by angular directives and handed over to Chart.js.
angular.module('moolah')

    .controller('dailyTransactionreportController', ['ReportService', function(ReportService) {
        var self = this;

        self.cardTitle = 'This Week';

        ReportService.dailyTransactionReport().success(function(d) {
            self.data = d.data;
            self.labels = d.labels;
            self.series = d.series;
        });
    }])

    .directive('dailyTransactionReport', ['toStatic', function(toStatic) {
        return {
            restrict: 'E',
            controller: 'dailyTransactionreportController',
            controllerAs: 'reportCtrl',
            templateUrl: toStatic('app/directives/daily-transaction-report.html'),
            bindToController: true,
            scope: {}
        };
    }]);
The data gets bound to the controller and passed to the angular-Chart.js API in the template.
<moolah-card card-title="reportCtrl.cardTitle">
  <canvas class="chart chart-line" chart-data="reportCtrl.data"
          chart-labels="reportCtrl.labels" chart-legend="true"
          chart-series="reportCtrl.series">
  </canvas>
</moolah-card>
Each morning, the app needs to create a new transaction representing the
total of all our
Rate objects.
I created a
QuerySet
function off of
Transaction to
fetch the total of all the rates and create a new
Transaction for
that amount.
class TransactionQuerySet(TransactionBaseQuerySet):
    def transact_rate_balance(self):
        transaction = self.model()
        transaction.description = ('Rate Balance for {0}'
                                   .format(get_timestamp()
                                           .strftime("%m/%d/%Y")))
        transaction.amount = Rate.objects.total()
        return transaction.save()
Next, I created a handle for running this code using the runscript function in django-extensions.
from tracking.models import Transaction

def run():
    Transaction.objects.transact_rate_balance()
Lastly, I created a cronjob to run the following script each day at midnight.
#!/bin/bash
# moolah.sh
# Runs moolah.scripts.rates
python_path=/home/alex/envs/moolah/bin/python
script_path=/home/alex/git/moolah/manage.py
${python_path} ${script_path} runscript rates
And that’s pretty much it!